Bart de Bruin

I am a PhD candidate in the Technology, Innovation and Society group at the Faculty of Industrial Engineering and Innovation Sciences, Eindhoven University of Technology. Within my research I apply computational methods such as agent-based modeling and network science to understand the complex dynamics behind social processes, including political polarization and the diffusion of sustainable behavior. Bart holds a BSc in Technology, Policy & Management from TU Delft and an MSc in Industrial Ecology from Leiden University and TU Delft, combining socio-technical systems analysis with sustainability assessment. Besides my work as PhD candidate, I collaborate with Platform Energie Bewustzijn on the project "Rond de Klok Groen". My Research Fields of interest are Energy Transition, Social Tipping, Social Networks, Polarization, Response Item Networks, Opinion Dynamics, Value Change.

Portrait

Interactive Apps

The idea that 'a picture is worth a thousand words' is widely applied within science communication. During my research I came up with an alternative to this statement: 'an interactive app is worth a thousand pictures'.
“An Interactive App is worth a Thousand Pictures”

I, as a computational social scienticts, use computational models as experimental labratories in which I aim to disentangle the complexities within today's society. The goal of my models is not to predict the future, but to expose how the dynamic interplay of social processes on the microlevel might be an explanation of the observed macro-level phenomena like for example political polarization and the accelaration of sustainable behavior adoption. To make our research findings accessible to a broader audience, I believe that we, as modelling community, need to open up our black box models.

Beyond publishing the code of the computer model and explaining the model design principles, I advocate for making the modelling results open access. Active interaction with the modelling output, bridges the gap between the model and you, the target audience. If you can test yourself what happends to the model dynamics if parameter settings are interest, developing a more nuanced understanding of the dynamics between model components, input data and modelling outputs will be much easier and intuitive.

With this idea in mind, I have developed multiple Open Access Interactive Applications for several of my research outputs in which you, as a person of interest, can generate your own graphics based on the data of the conducted empirical research or simulation models.

Dutch Elections

Open

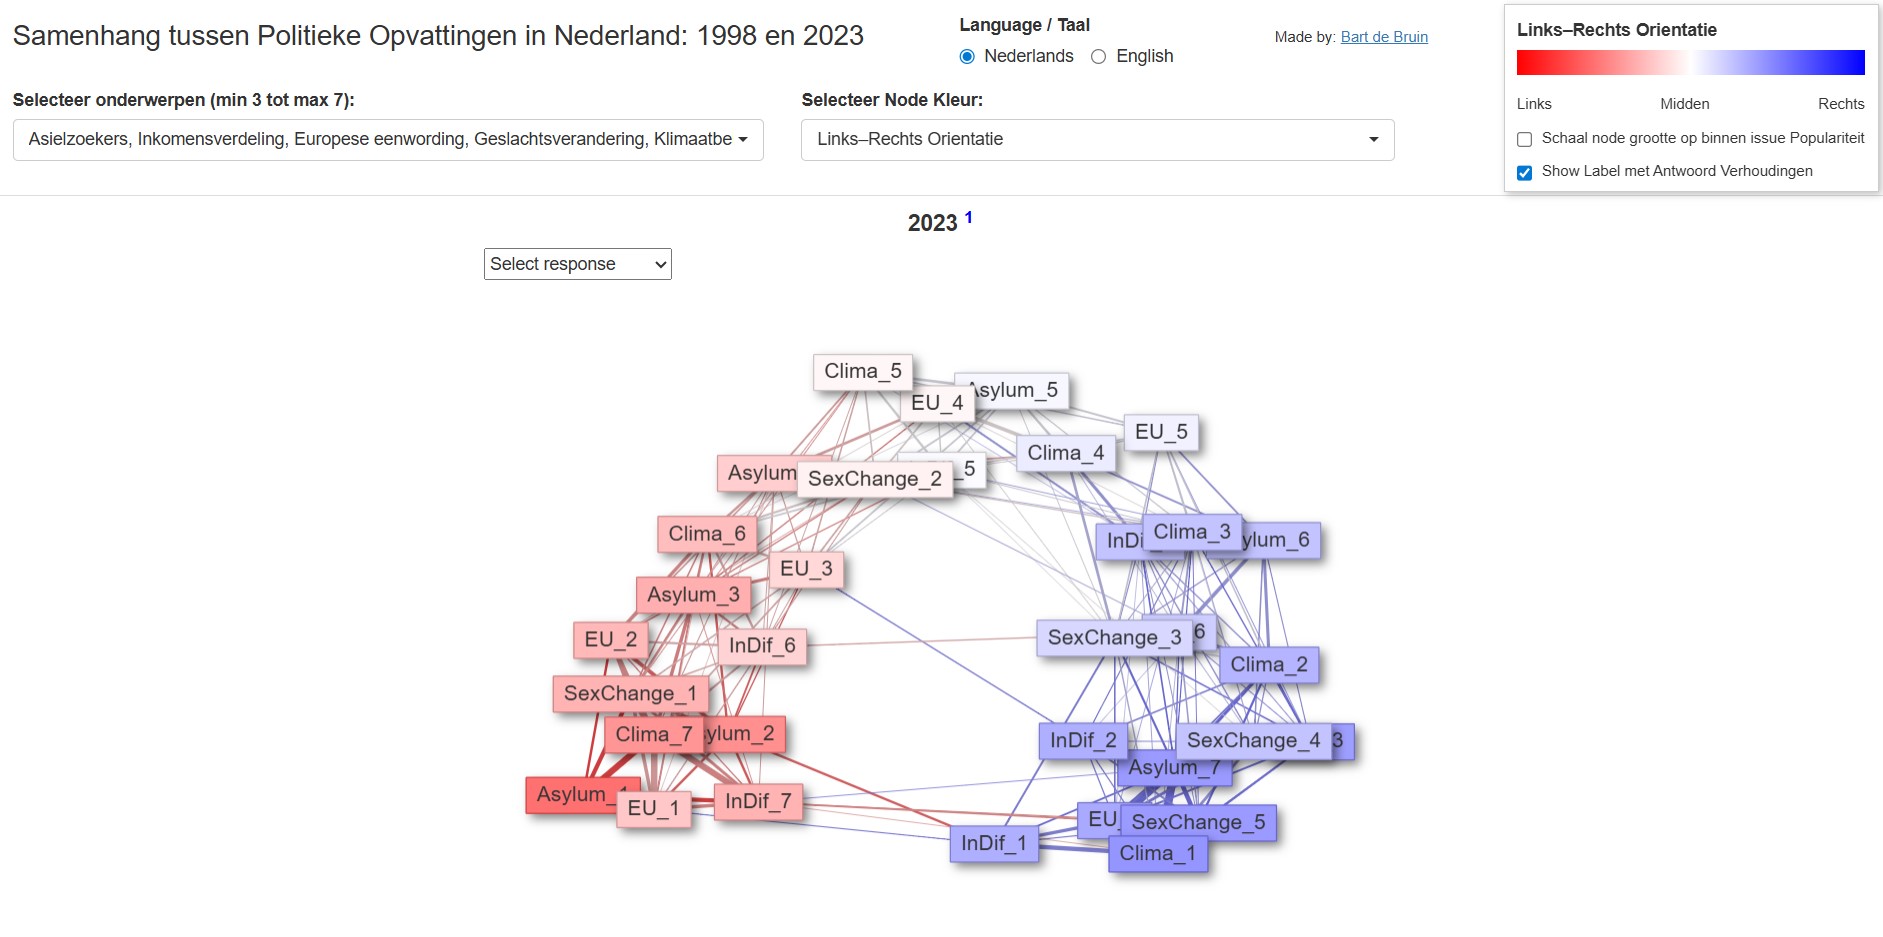
With this application you can analyze how polarized the Dutch political landscape really is. By applying the new method called Response Item Networks on all the Dutch Election Surveys between 1998 and 2023, I invite you to explore the temporal dynamics in Issue Polarization, Issue Asymmetry and Partisan Sorting on a variety of issues. For a full introduction about what polarization is, how Response Item Networks are constructed and how to use the application, please click on the left Video. After watching the video, you can access the interactive application by clicking on the thumbnail on the right!.

TENTASS — Testing Network Topology and Seeding Strategies

Open

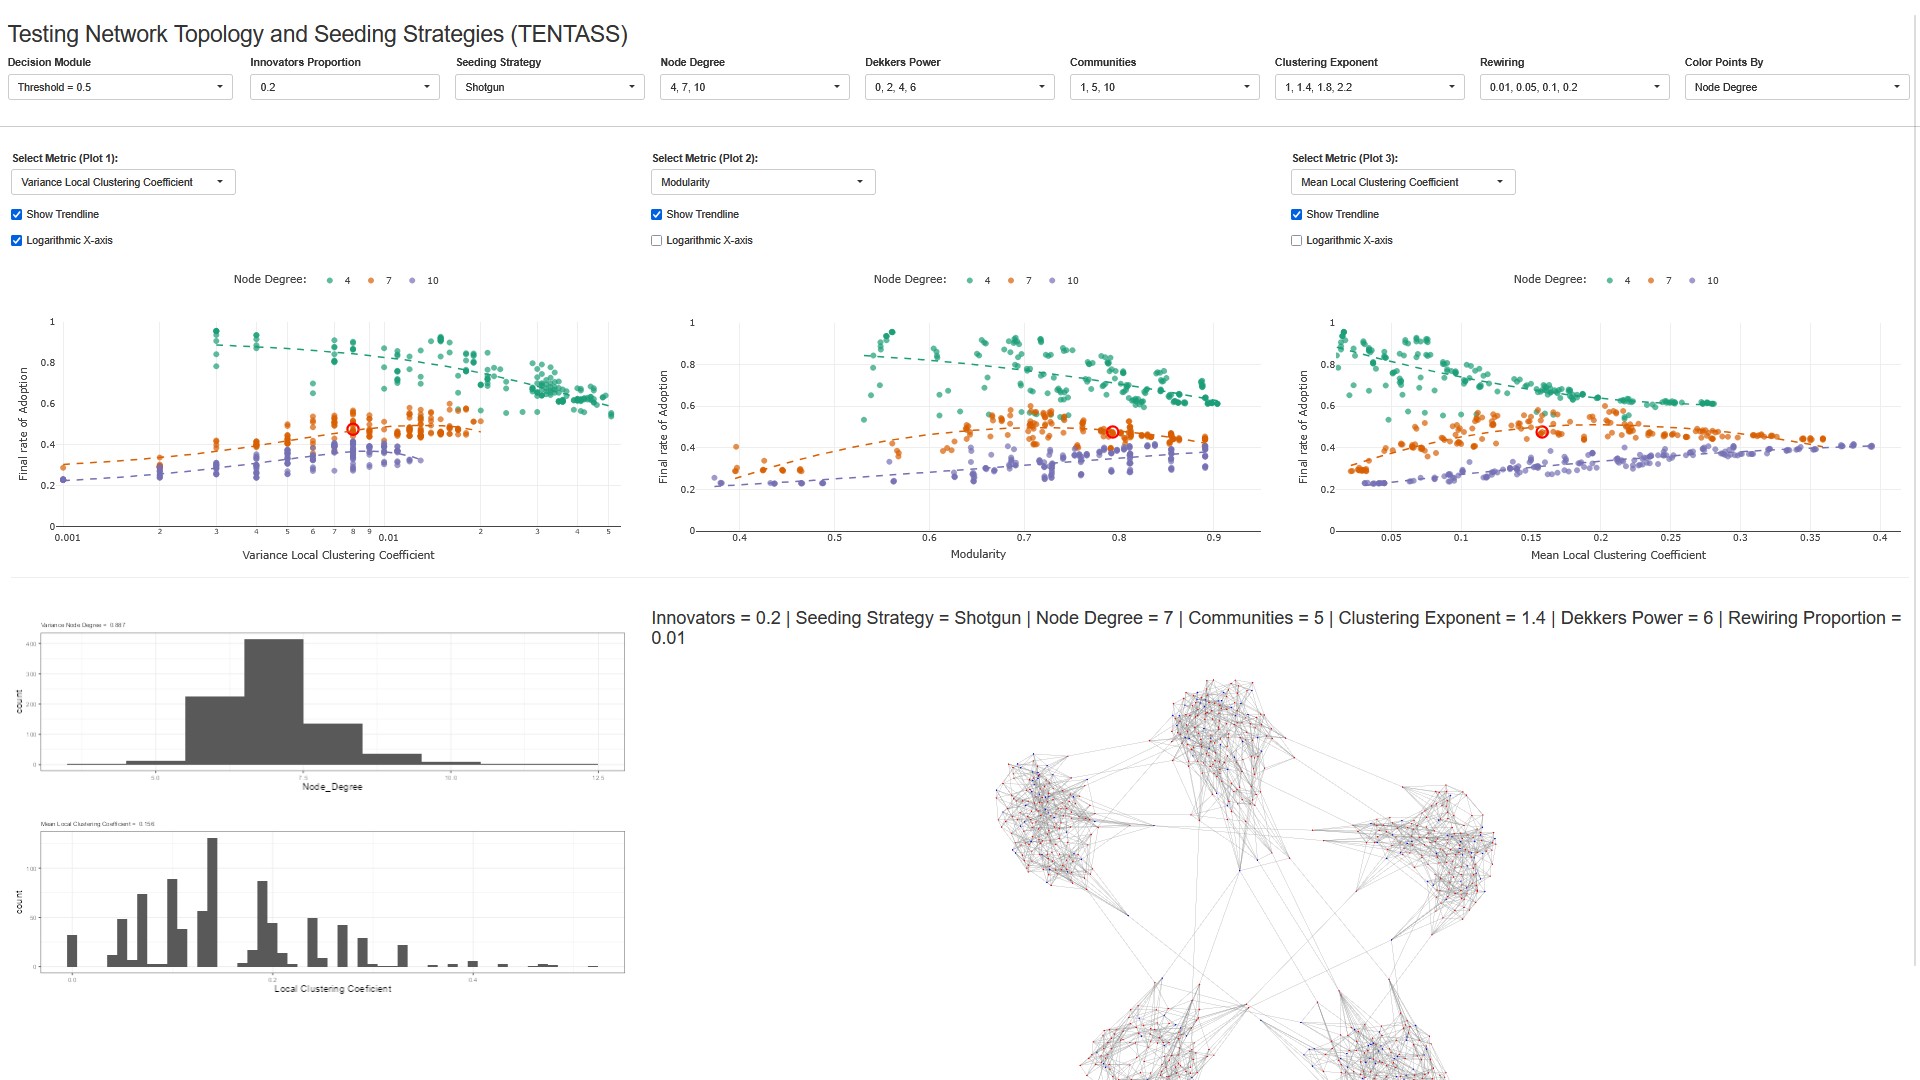
Behaviour does not spread like a virus. People usually need several reinforcing signals from different peers before they adopt a technology or change a habit, which makes the outcome highly dependent on the shape of the social network and on where the first adopters sit. Local clustering gives people the reinforcing neighbours a cascade needs to get started, but too much of it comes at the cost of the wide bridges that carry a local cascade to the rest of the network. TENTASS maps that trade-off across 31,104 parameter combinations — five network properties, three seeding strategies, the share of innovators and six decision rules — each averaged over roughly 400 repetitions, more than 12 million simulation runs in total. The takeaway is that if threshold or network models like these are used to inform policy design, robust decisions require very extensive testing of network topology and seeding strategy. The video on the left shows how one network is built, seeded and run; the thumbnail on the right opens the full result set.

RIA2 — Replicating Patterns of Issue Alignment and Issue Asymmetry

Open

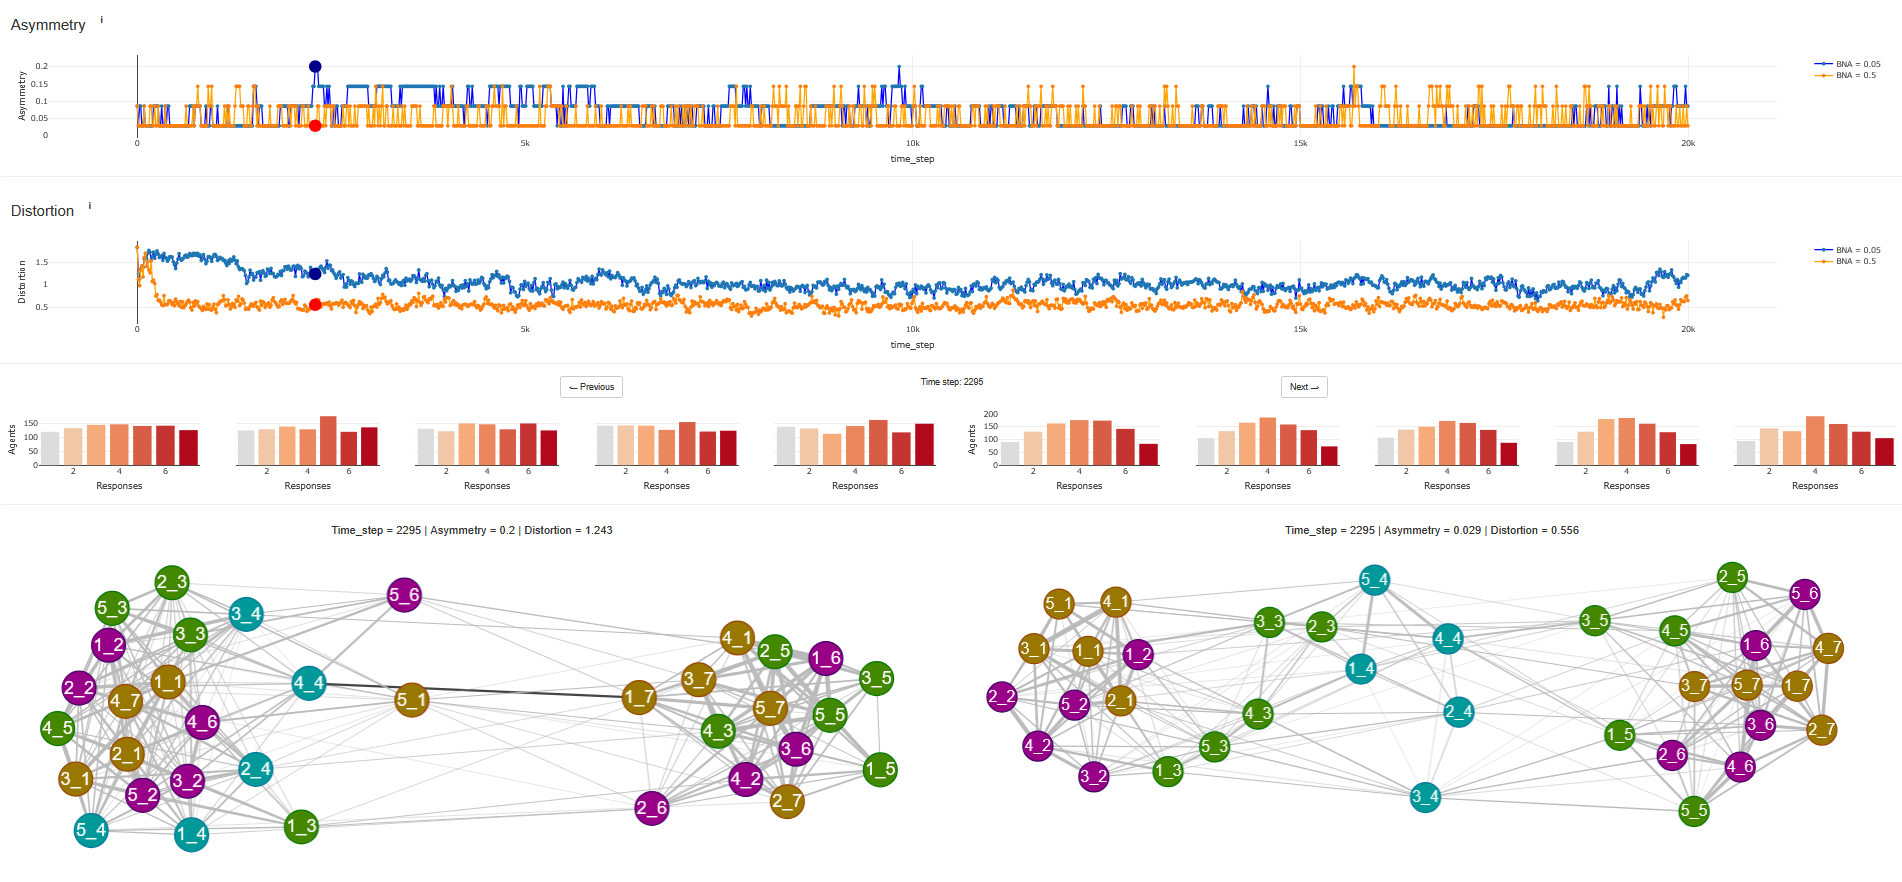
Opinions regarding political issues do not sit in our heads as isolated silos. Election survey data from the Netherlands and the USA show that responses on different issues are systematically constrained (i.e. issue alignment); knowing someone's view on climate makes you able to predict pretty well their views on other issues like income differences. Issues also turn out to be asymmetric: the two sides of a question often do not behave like opposites, and the people who answer neutral can sit ideologically much closer to one extreme than to the middle. By assuming three simple behavior rules we aimed to replicate these patterns of issue alignment and issue asymmetry: 1) agents are aware of other agents' opinions on a variety of issues, 2) agents use these insights to form a perception of how issues are constrained, 3) this perceived constraint urges agents to alter their opinions on several issues in such a way that they align with the perceived constraint. The model shows, for different implementations of the way agents construct the system of issue constraint within their heads, how issue asymmetry and issue alignment emerge at the population level. It takes the empirical data from the Dutch Elections as a reference case to see how well the model is able to replicate existing issue alignment and issue asymmetry metrics. The video on the left shows two configurations developing side by side; the figure on the right lets you step through the runs yourself by opening the application.

Publications

Contact