Replicating Patterns of Issue Asymmetry and Issue Alignment
Aggregated results across 20 repetitive runs
Legend:
Simulation results
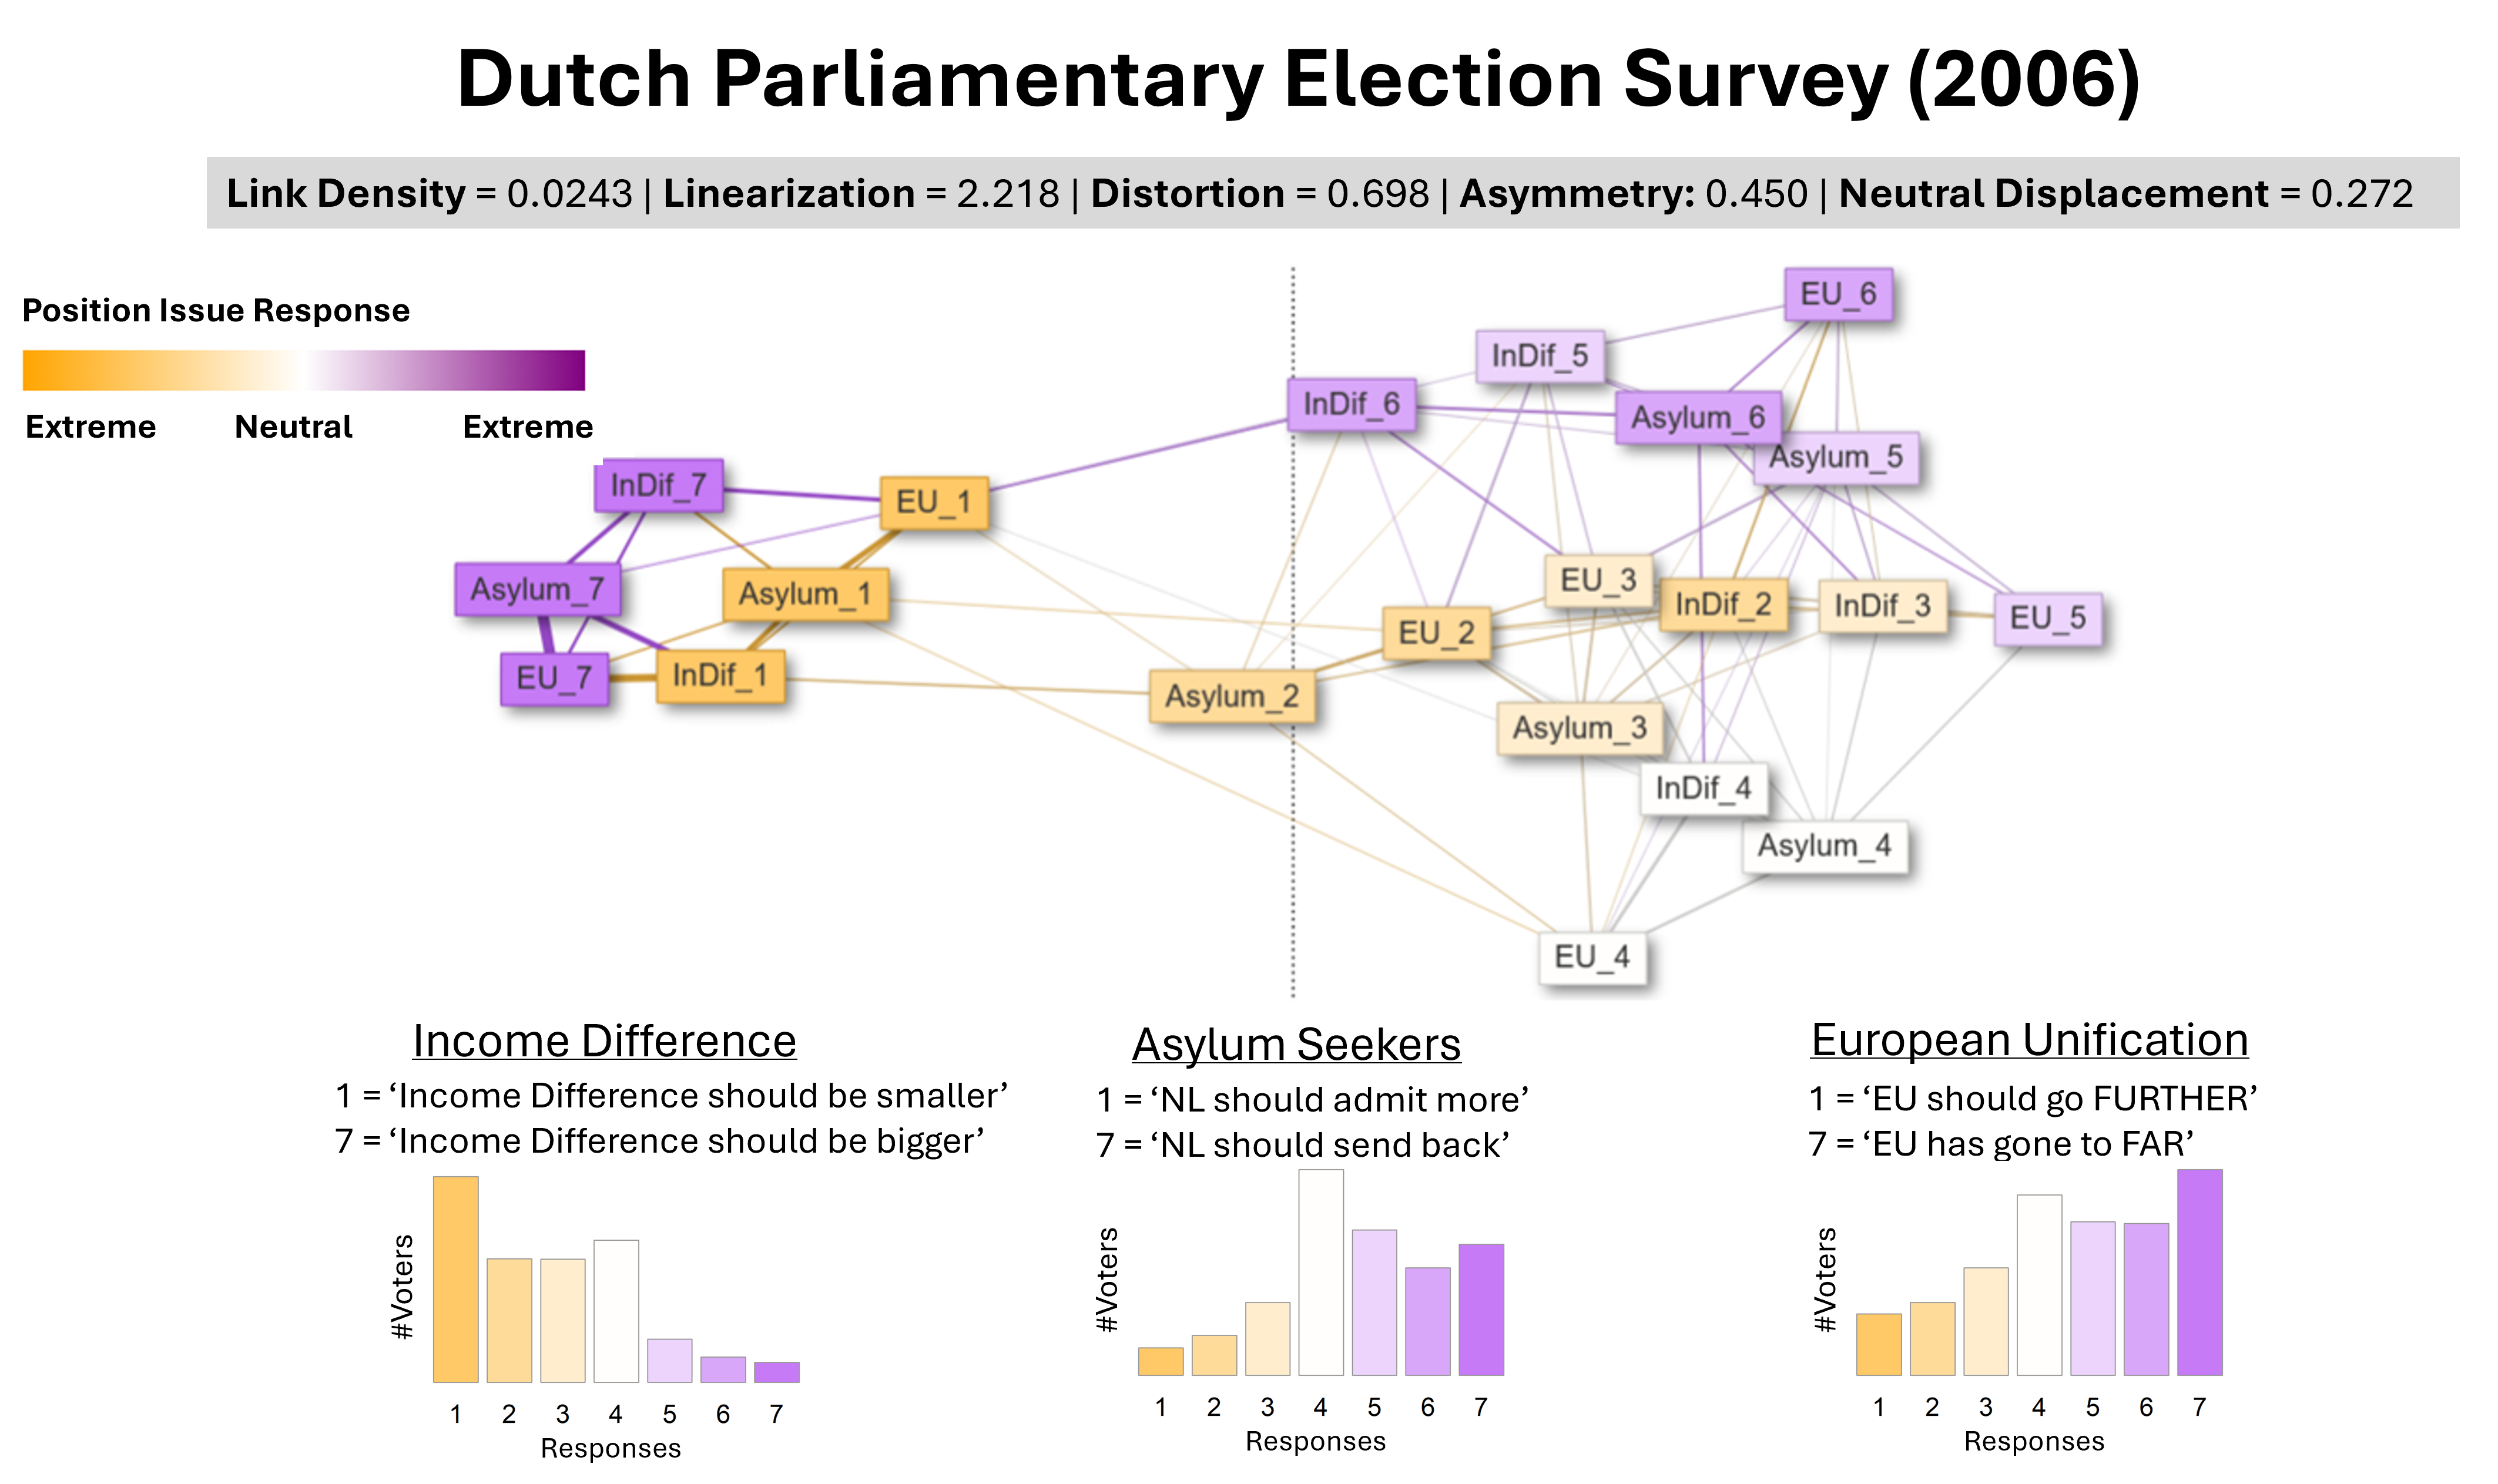
DPES 2006
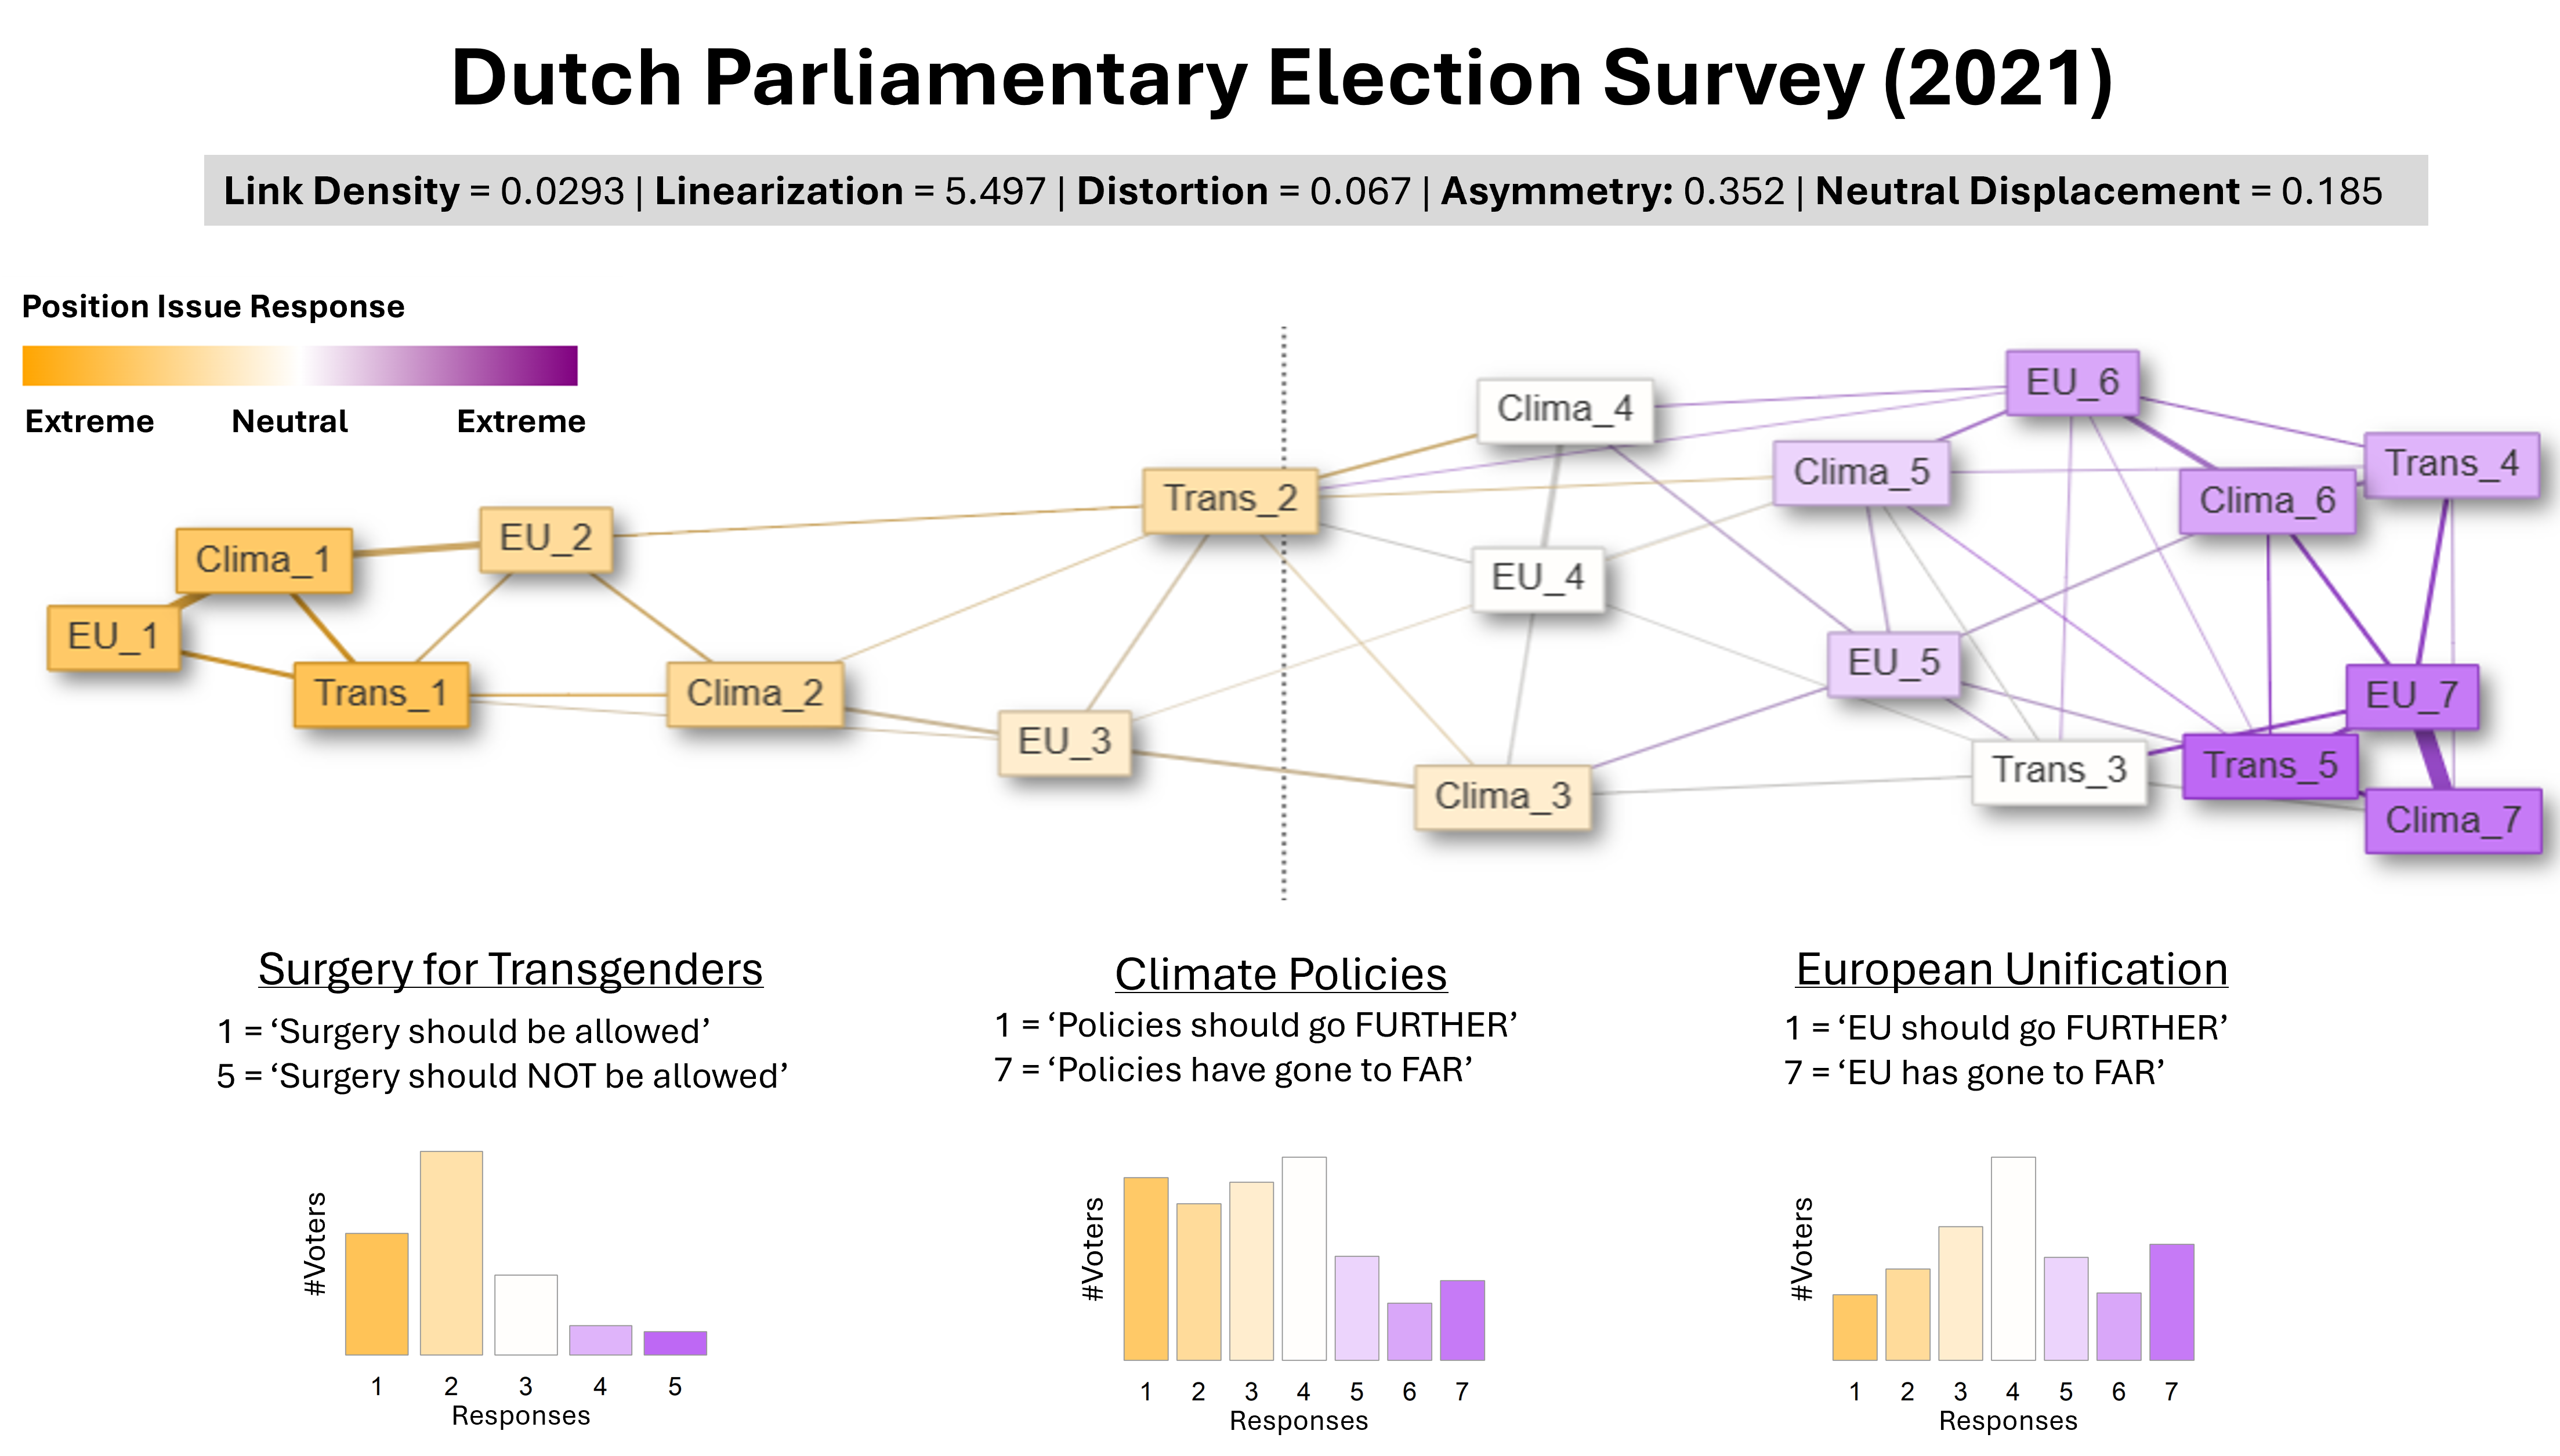
DPES 2021
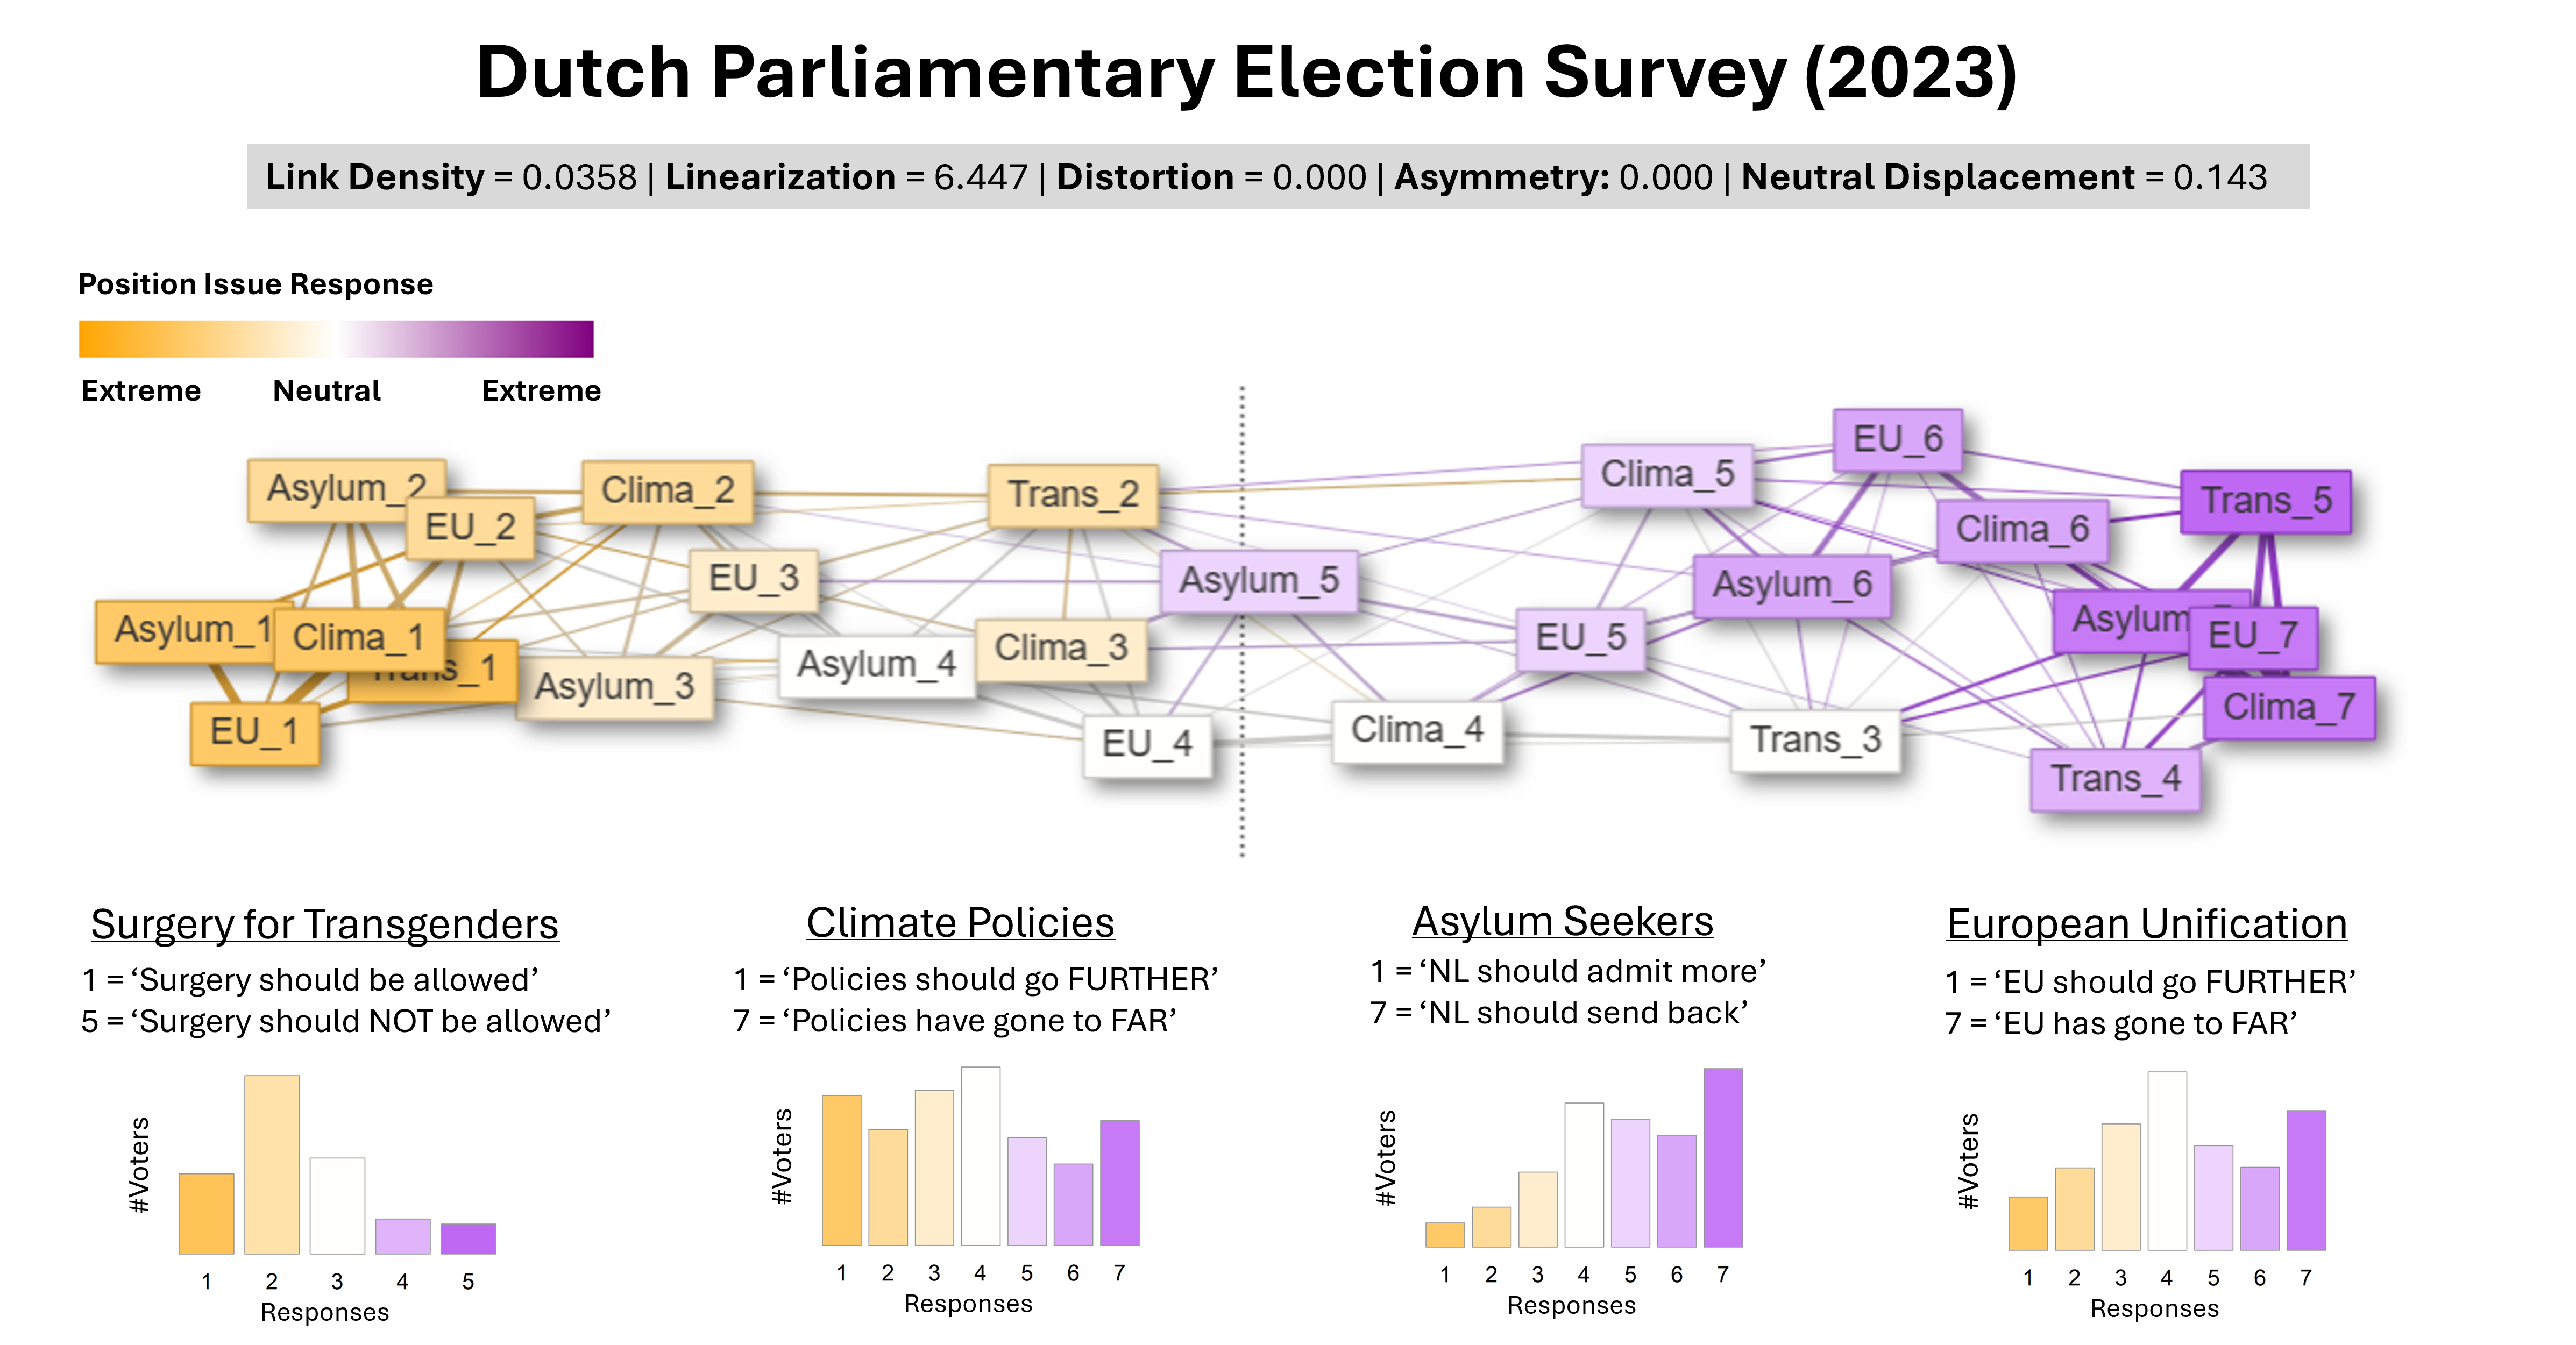
DPES 2023
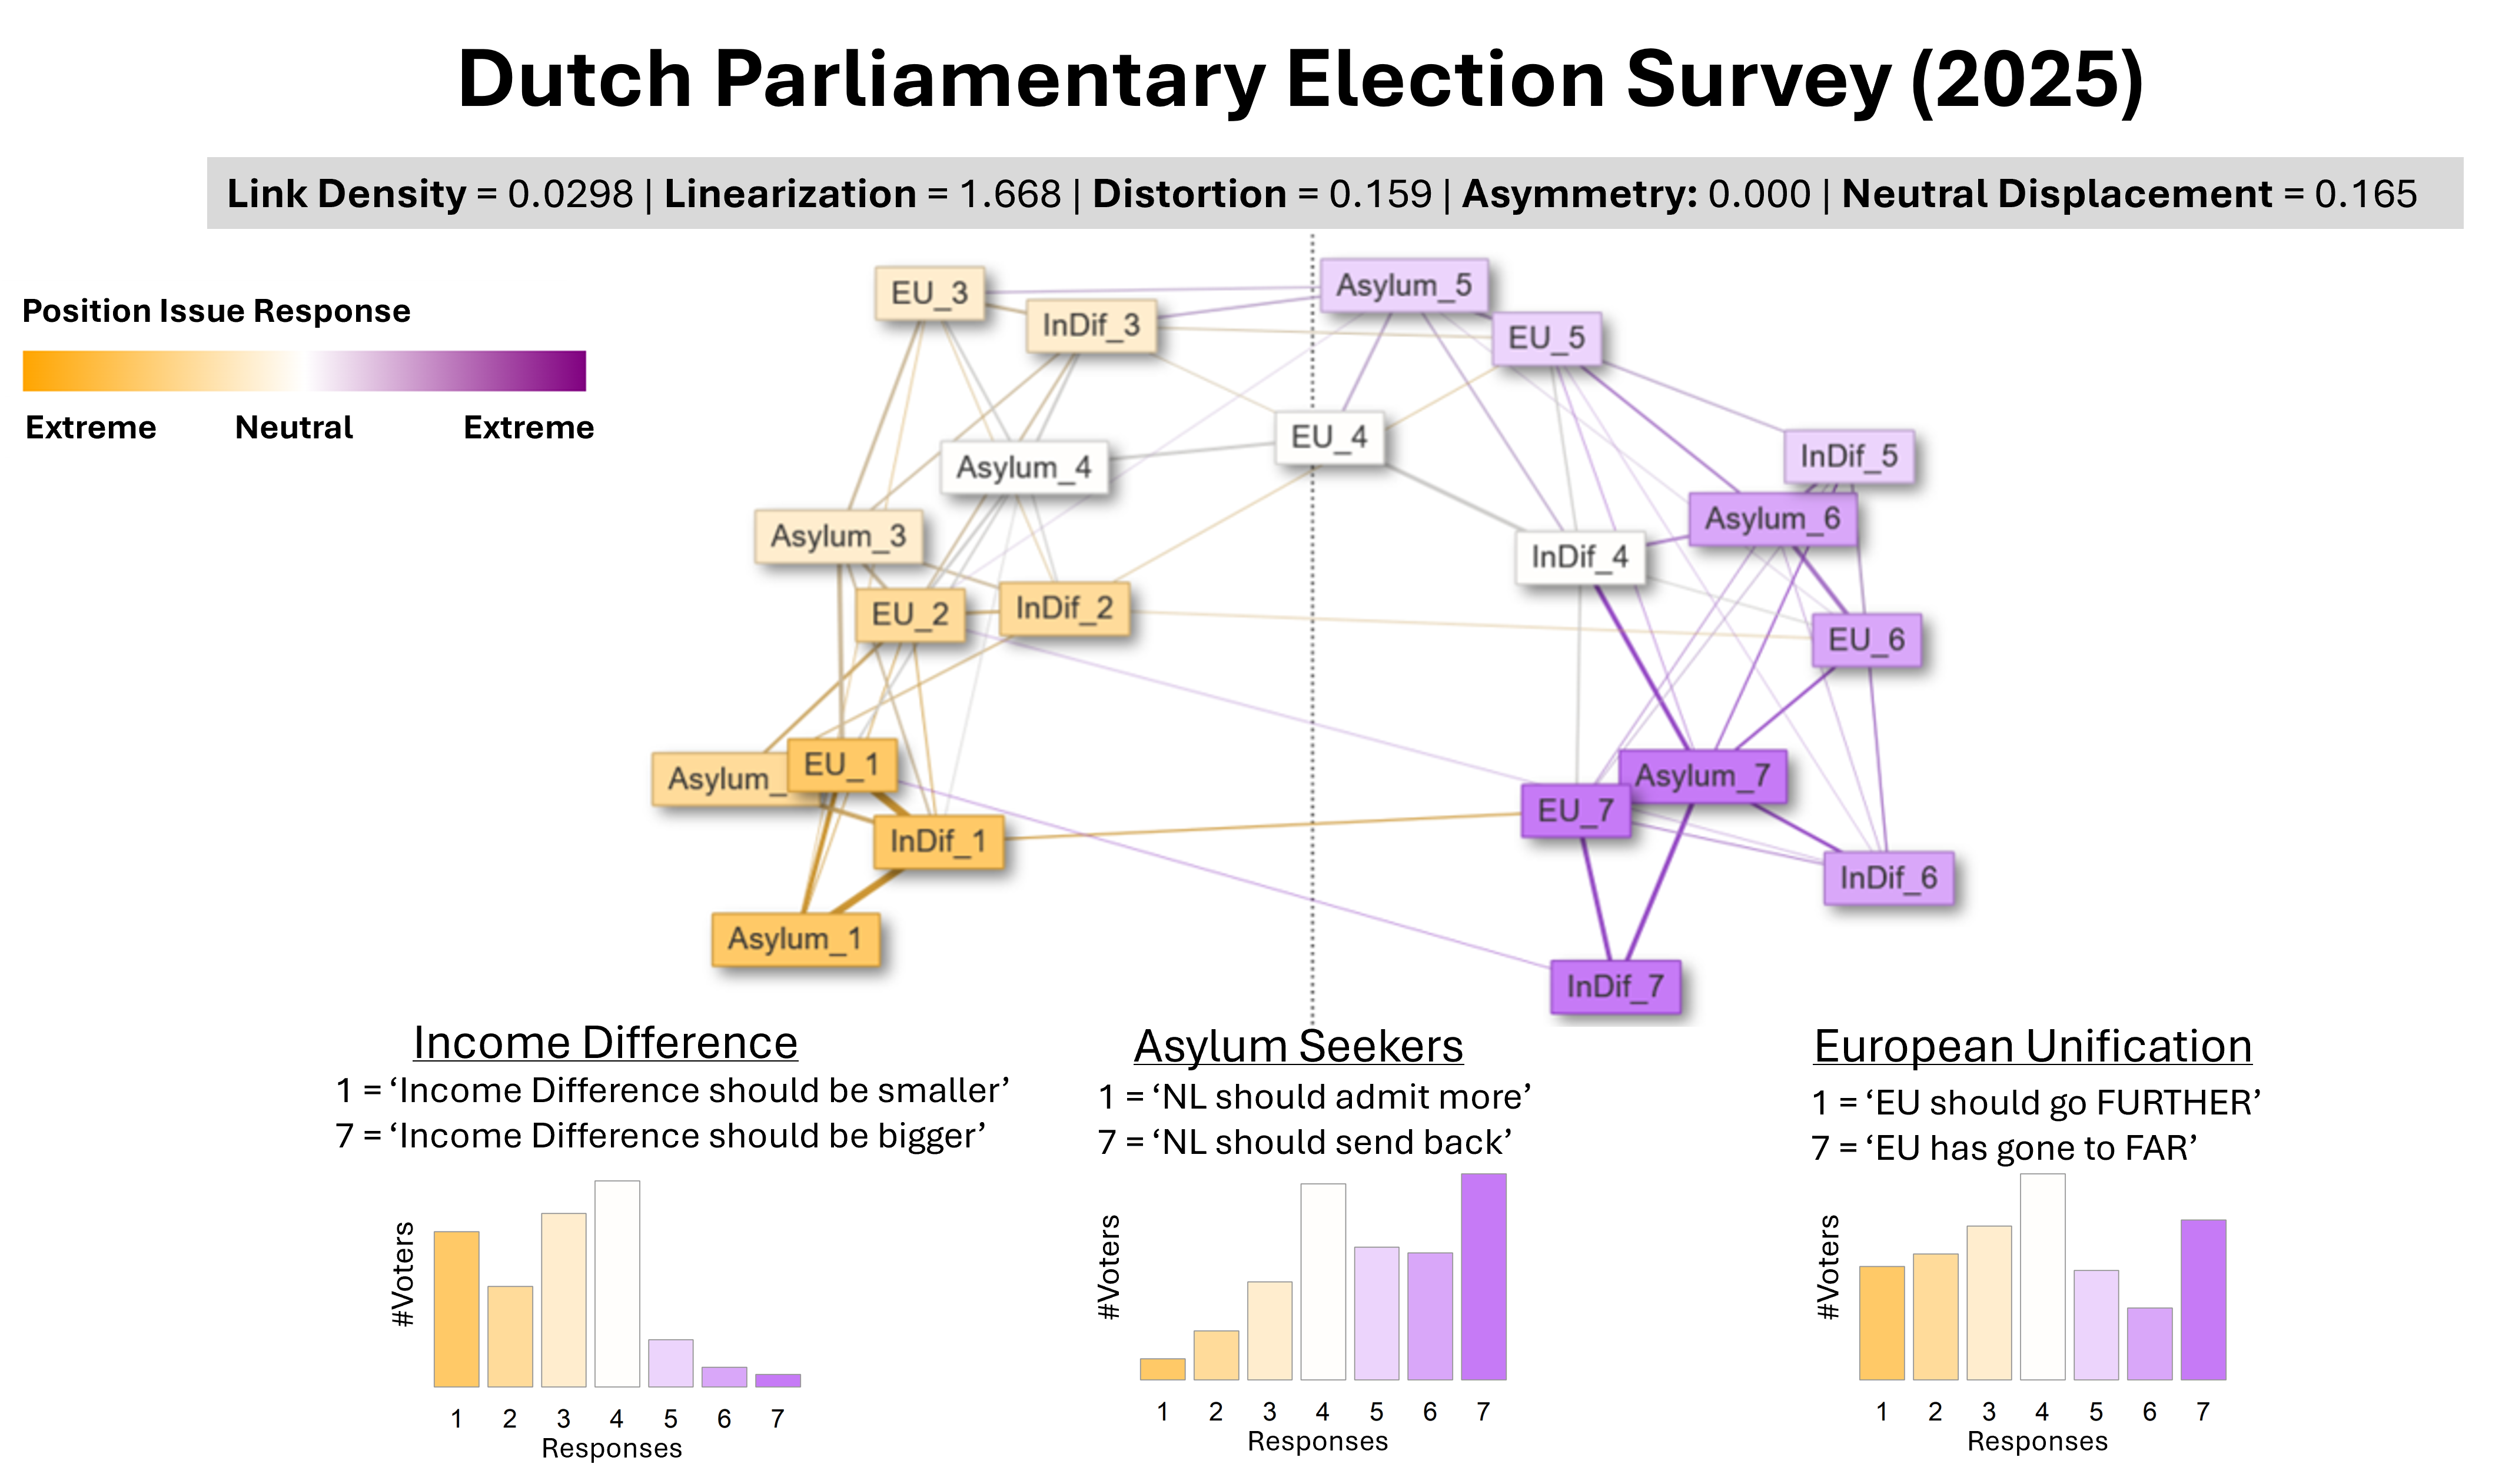
DPES 2025
Asymmetry

Neutral Displacement

Distortion

Linearization

Link Density

Compare two metrics
Each dot is one model network (sweeps 1,000-2,000, every 10 sweeps, all seeds) for the population selected above, coloured by λ; squares are the DPES waves.
How many model networks look like each DPES wave?
Per pair of metrics and DPES wave: the % of model networks (same population and λ as the plot) within ±10% of each metric's range of the wave on both metrics. The same with the two metrics swapped, so only the upper triangle is shown; on the diagonal: that metric alone. Red: under 1% (almost no model network looks like the wave); orange: under 5%. > max / < min: the wave lies above / below every model network on one of the two metrics.