Comparing Belief Networks across Surveys
Made by: Bart de Bruin
Build time series by picking a survey, one or more countries (for the ESS and EVS) and the issue items, then press Update figures. The five ResIN metrics are plotted for every year in which all chosen items were asked. Click a year in any chart to draw the networks of all series for that year below.
Extreme Distance
iExtreme Distance
Average distance between the two extreme answers of each issue (e.g. 'strongly agree' and 'strongly disagree'), relative to the widest distance in the network. 0 = the extremes lie together; 1 = they lie as far apart as the network is wide.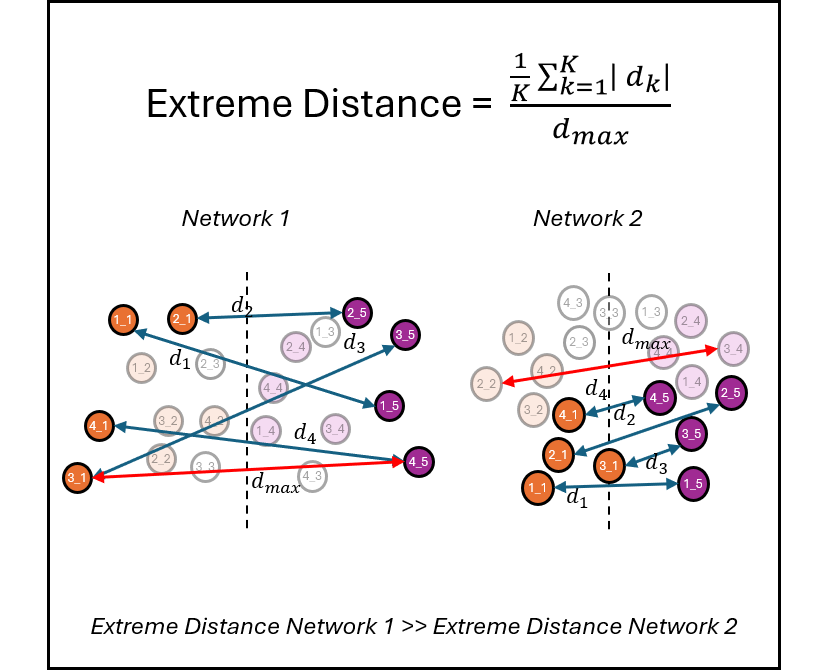
Separation
iSeparation
Separation between the two clusters of extreme responses. For each issue, the two extremes are sorted into two opposing camps by maximizing modularity. The final score compares how strongly the extremes are correlated within their own camp with how strongly they are correlated with the other camp, relative to chance. 0 = no camps, 0.5 = two fully separated camps.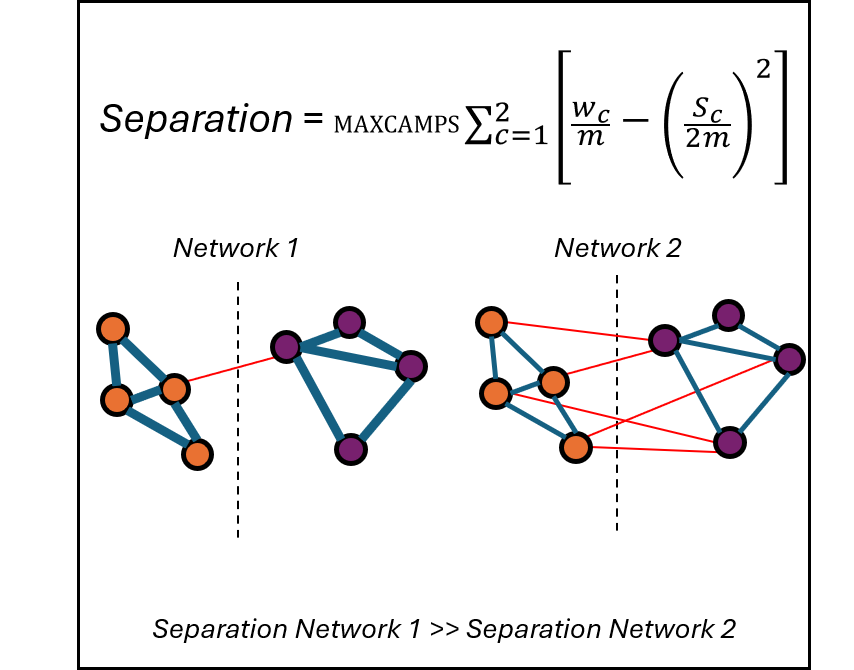 Chen et al. (2025), Network Science. doi:10.1017/nws.2025.10016
Link Density
iLink Density
Average strength of cross-issue correlations. Higher values = stronger overall constraint between political attitudes.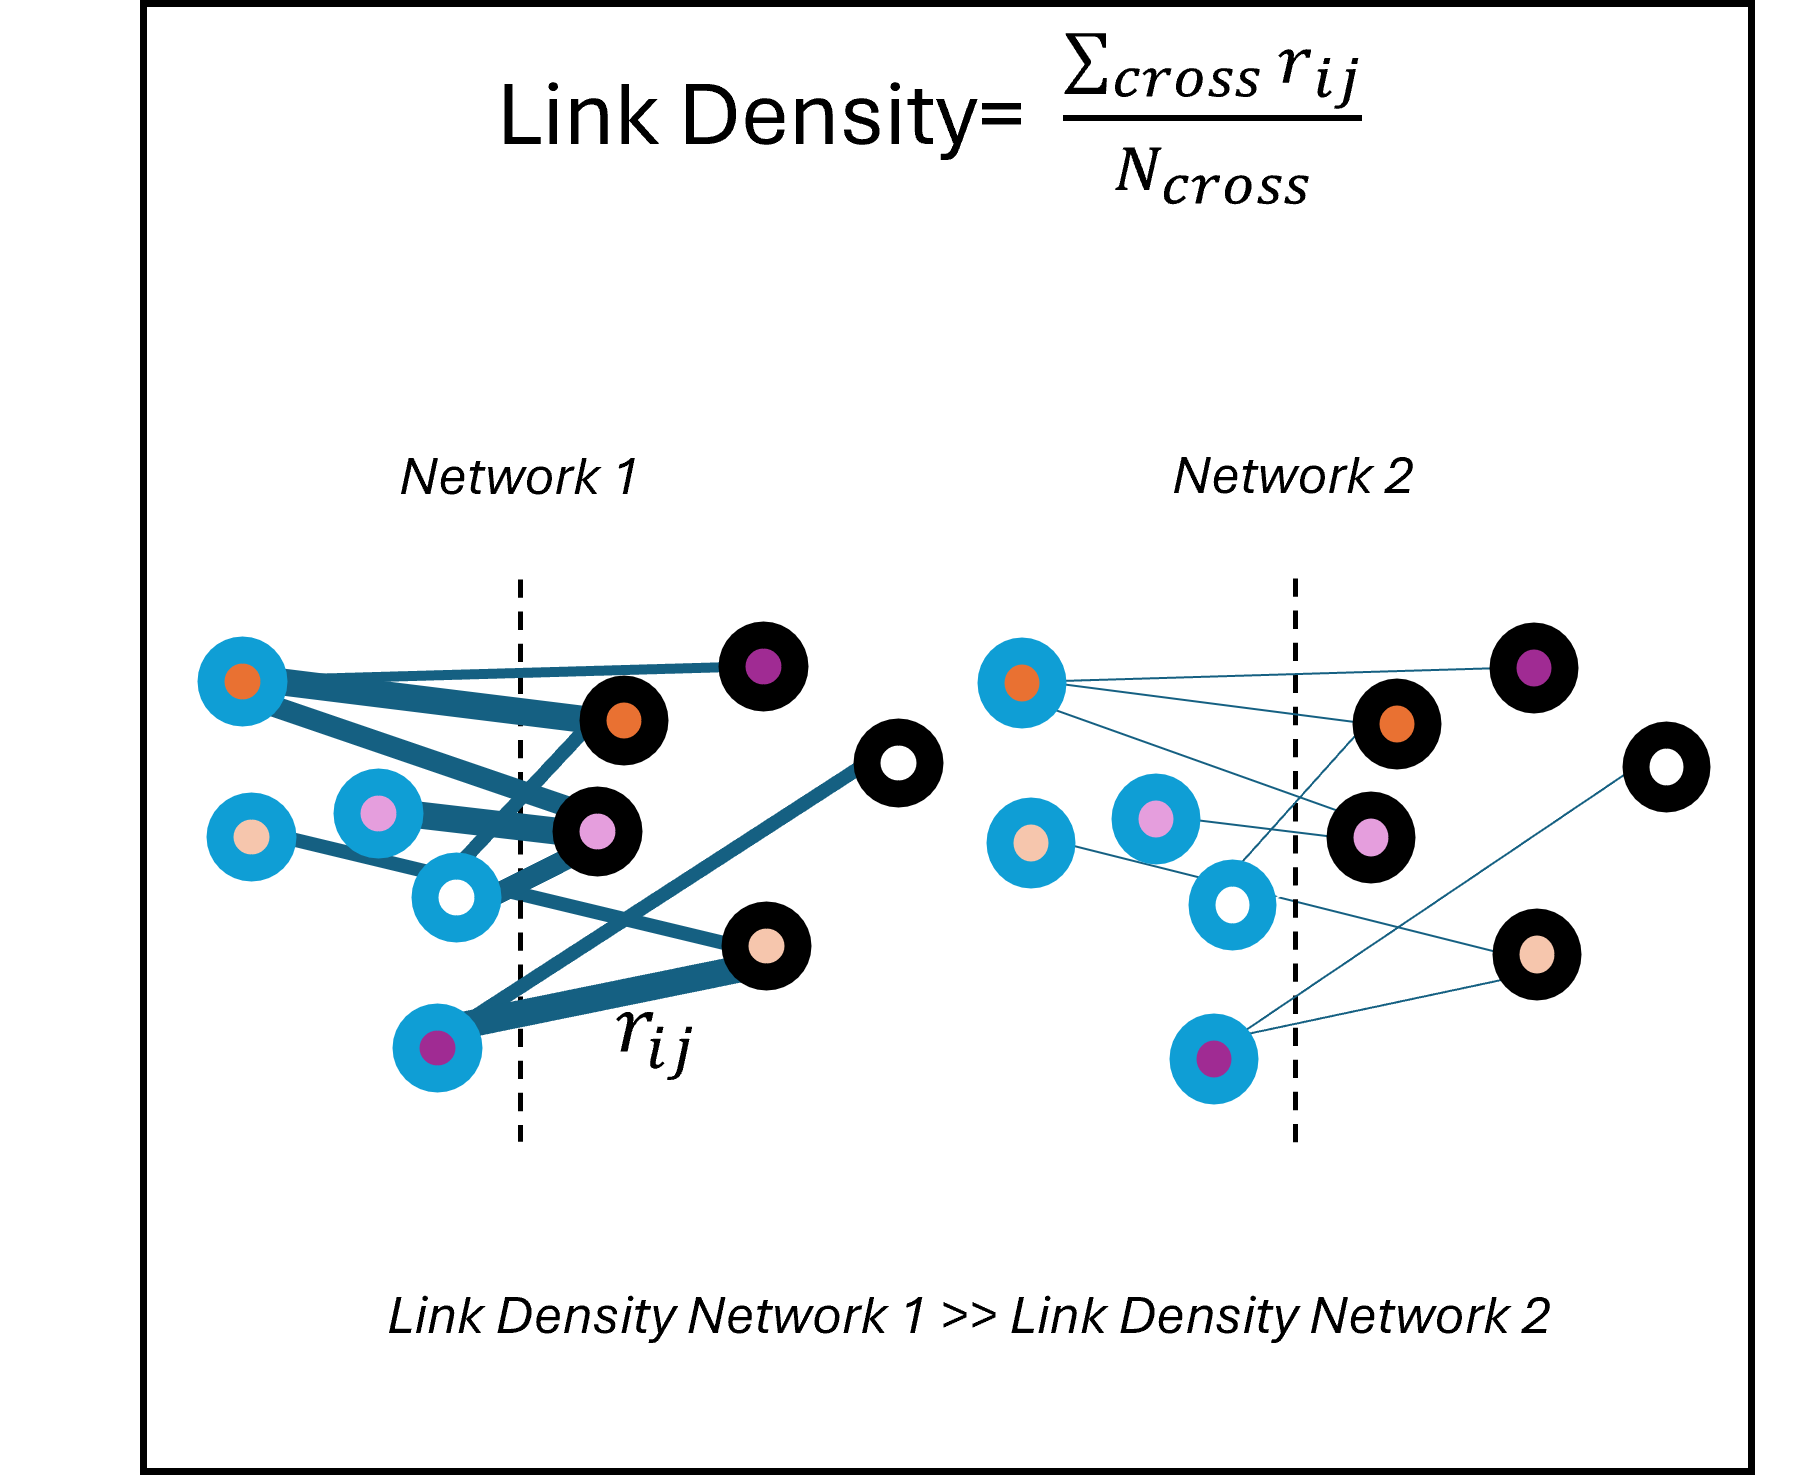 Chen et al. (2025), Network Science. doi:10.1017/nws.2025.10016
Linearization
iLinearization
How 'flat' or one-dimensional the belief network is. High values indicate attitudes collapse into a single left-right axis.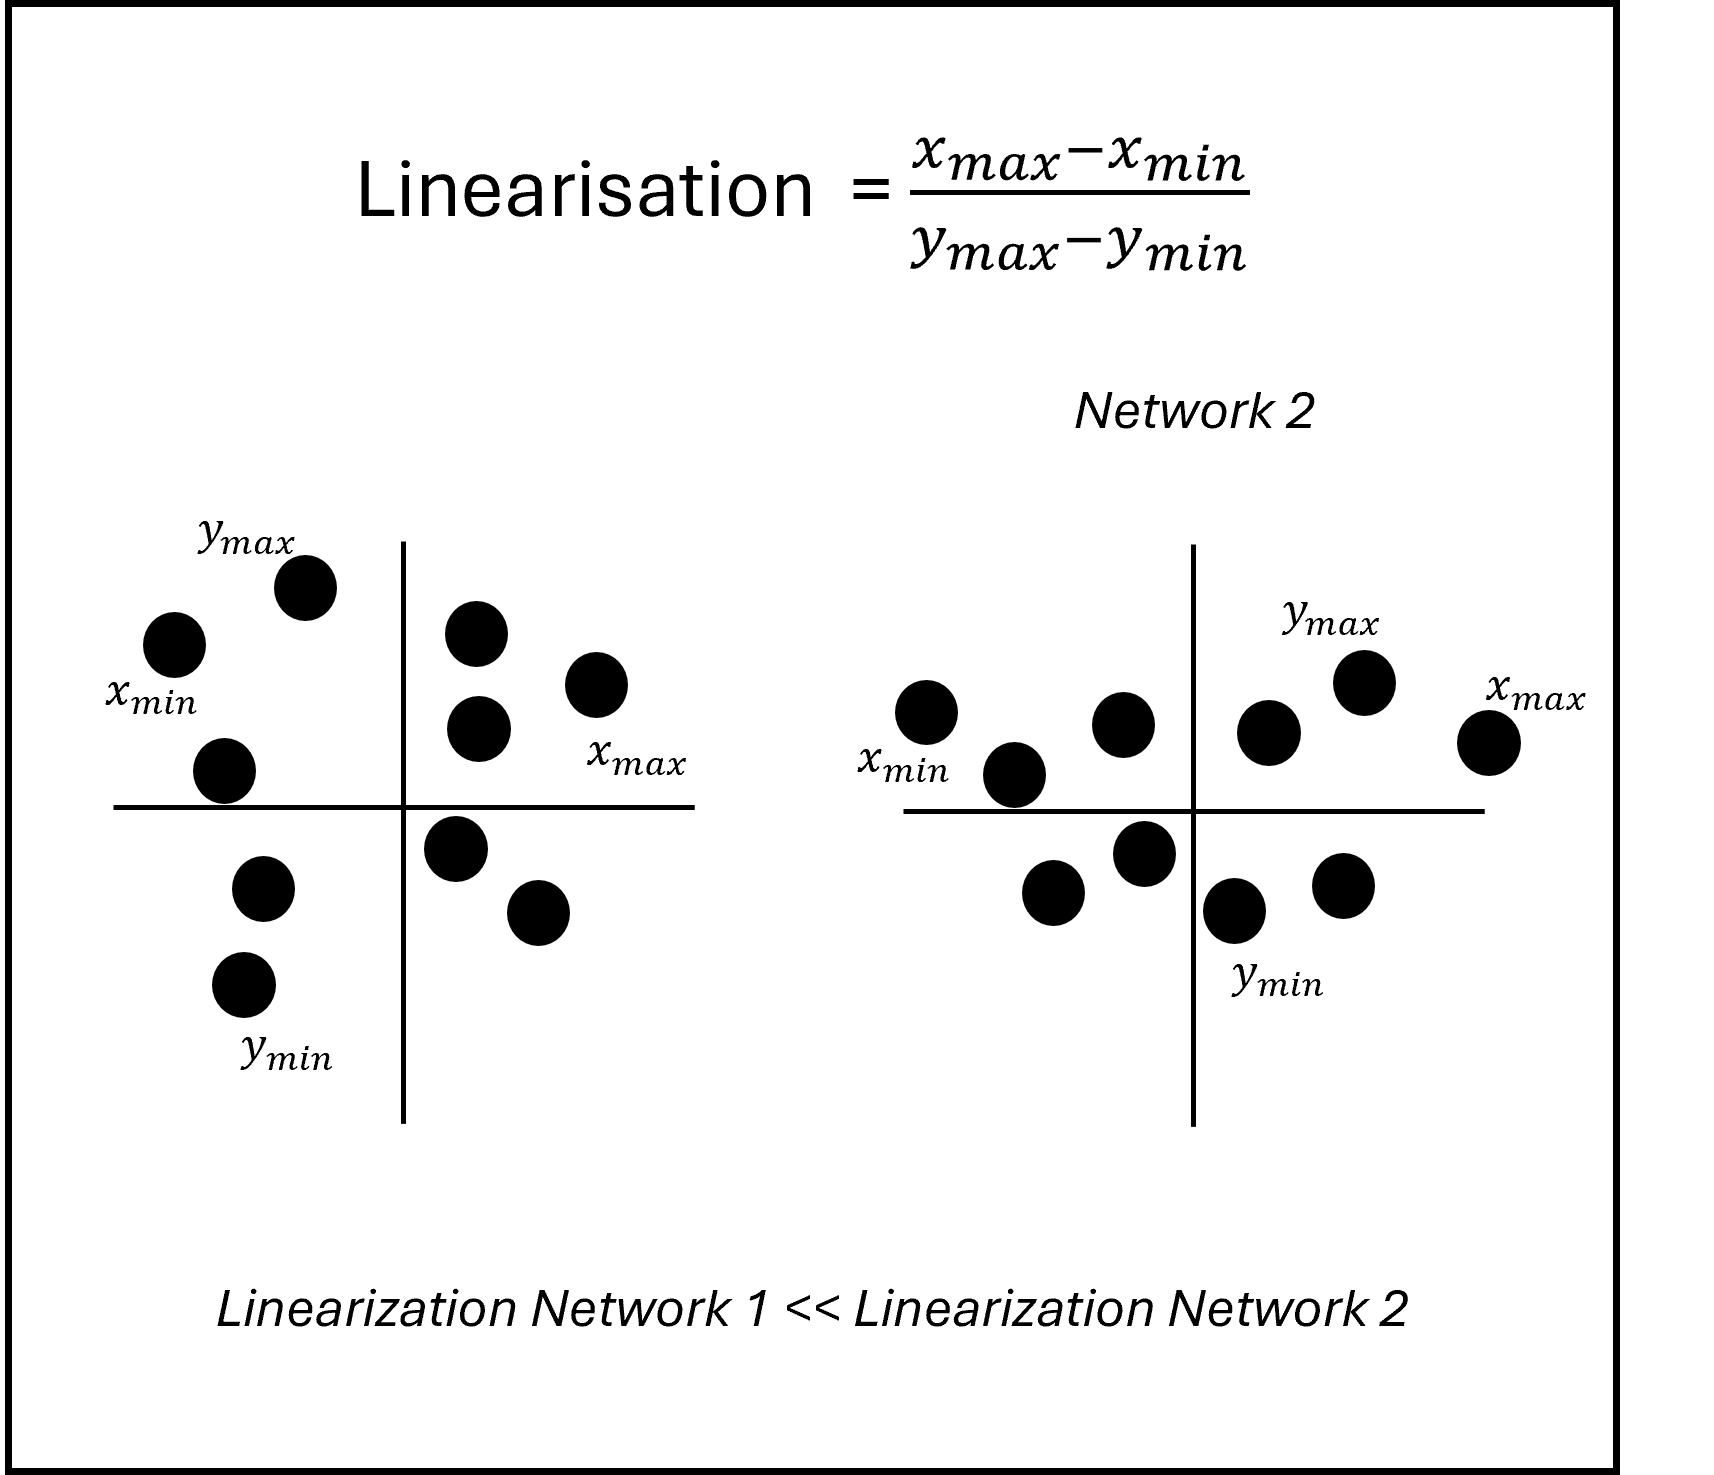 Chen et al. (2025), Network Science. doi:10.1017/nws.2025.10016
Neutral Displacement
iNeutral Displacement
How far neutral (middle) response nodes deviate from the center (x = 0). Higher = neutral opinions pulled toward one side.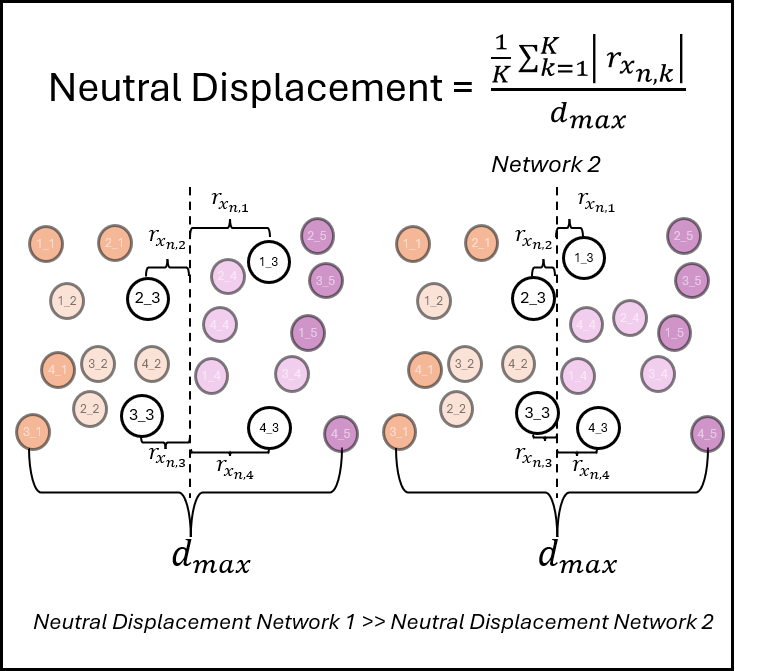
Networks
Metrics: median over 100 Fruchterman-Reingold layouts per network (the single-survey apps use 500, so their values can differ slightly). Item names, wording, recoding and data sources are documented in each survey's own app (menu top left).